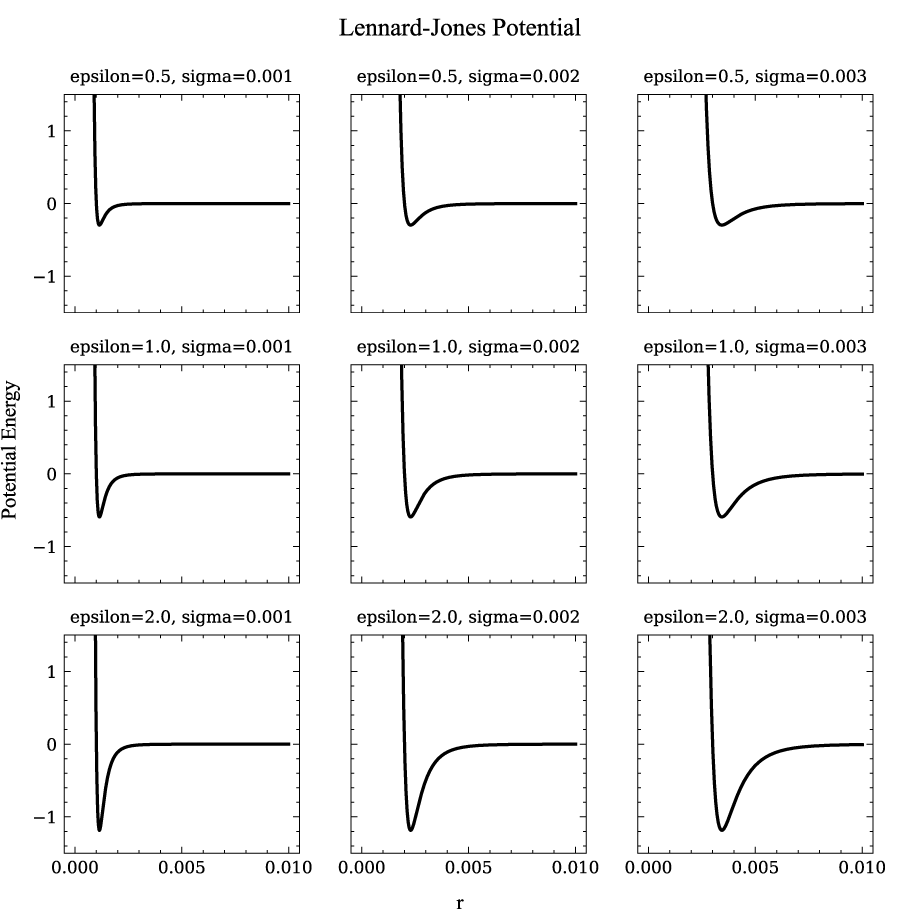
Lennard-Jones势能曲线是用于描述两个原子或分子间非键相互作用势能如何随它们距离变化的数学模型。这种势能曲线特别表示了在较短距离时相互作用力是排斥的(由于电子云的排斥作用),在较长距离时力变为吸引(由于范德瓦耳斯力),它有两个关键参数:
- (epsilon): 代表势能的深度,即分子间相互作用最强时的势能;
- (sigma): 是分子间达到势能最低值时的互相作用距离,也解释了分子的有效大小。
数学上,Lennard-Jones势通常表示为:
[ V(r) = 4\varepsilon \left[ \left( \frac{\sigma}{r} \right)^{12} – \left( \frac{\sigma}{r} \right)^6 \right] ]
这里,(V(r)) 是两个分子在距离(r)时的势能。第一项表示排斥势,与距离的12次方成反比;第二项表示吸引势,与距离的6次方成反比。这种模型虽简化,但被广泛用于分子动力学模拟,帮助预测和解释分子间作用力的物理行为。

import numpy as np
from matplotlib import pyplot as plt
import matplotlib as mpl
%matplotlib notebook
%matplotlib inline
%config InlineBackend.figure_format='retina'
mpl.rcParams['font.family'] = 'Times New Roman'

def ljpotential(epsilon, sigma, r):
    """计算Lennard-Jones势能"""
    a = (sigma/r)**9
    b = (sigma/r)**6
    return 4*epsilon*(a-b)

# 定义参数范围
epsilons = [0.5 ,1.0, 2.0]  # epsilon值列表
sigmas = [0.001 ,0.002 ,0.003]  # sigma值列表

# 定义距离范围
r = np.linspace(1e-6, 0.01, 1000)

# 计算子图的行数和列数
num_rows = len(epsilons)
num_cols = len(sigmas)

with plt.style.context("science"):
# 创建子图
    fig, axes = plt.subplots(num_rows, num_cols, figsize=(6, 6), sharex=True, sharey=True)

# 绘制曲线
for i, epsilon in enumerate(epsilons):
    for j, sigma in enumerate(sigmas):
        potential = ljpotential(epsilon, sigma, r)
        label = f"epsilon={epsilon}, sigma={sigma}"
        axes[i, j].plot(r, potential, label=label)
        title_font = {'fontsize': 8, }
        axes[i, j].set_title(label,fontdict=title_font)
        axes[i, j].set_ylim(-1.5, 1.5)  # 设置y轴范围

# 设置图形属性
fig.suptitle('Lennard-Jones Potential')
fig.text(0.5, -0.01, 'r', ha='center')
fig.text(-0.01, 0.5, 'Potential Energy', va='center', rotation='vertical')
fig.tight_layout()